") Attempt all questions.
Attempt all questions. Show all work.
(1.) Examine these scatter plots and determine whether each relation is linear or nonlinear.
(a.)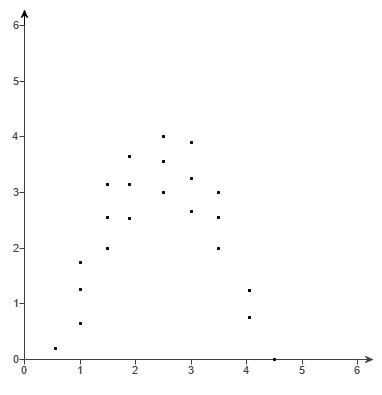
(b.)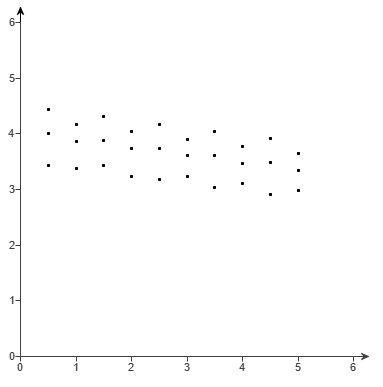
(c.)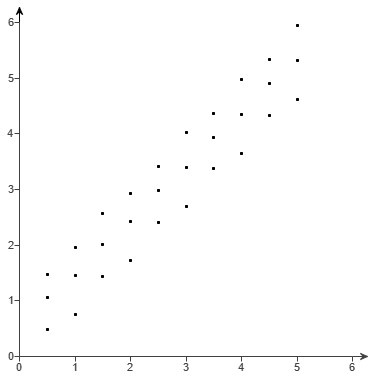
(d.)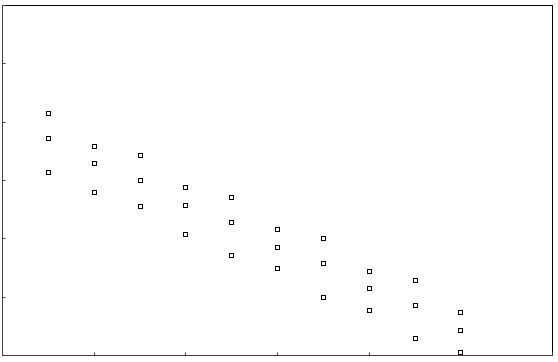
(e.)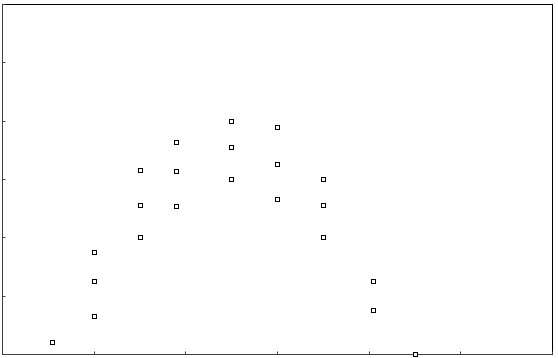
(f.)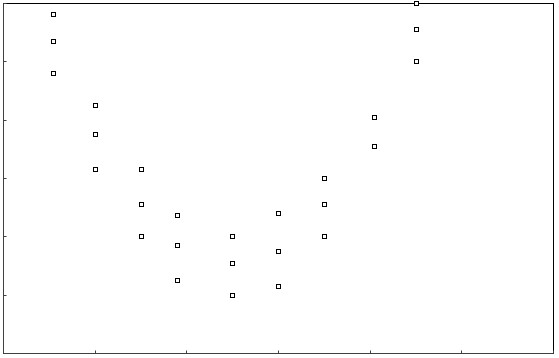
(a.) The relation is nonlinear because the data points in the scatter plot does not follow the pattern of a straight line.
It follows the pattern of the curve of a quadratic model: concave down.
(b.) The relation is linear because the data points in the scatter plot follow the pattern of a straight line.
The straight line pattern is that of a negative slope.
(c.) The relation is linear because the data points in the scatter plot follow the pattern of a straight line.
The straight line pattern is that of a positive slope.
(d.) The relation is linear because the data points in the scatter plot follow the pattern of a straight line.
The straight line pattern is that of a negative slope.
(e.) The relation is nonlinear because the data points in the scatter plot does not follow the pattern of a straight line.
It follows the pattern of the curve of a quadratic model: concave down.
(f.) The relation is nonlinear because the data points in the scatter plot does not follow the pattern of a straight line.
It follows the pattern of the curve of a quadratic model: concave up.